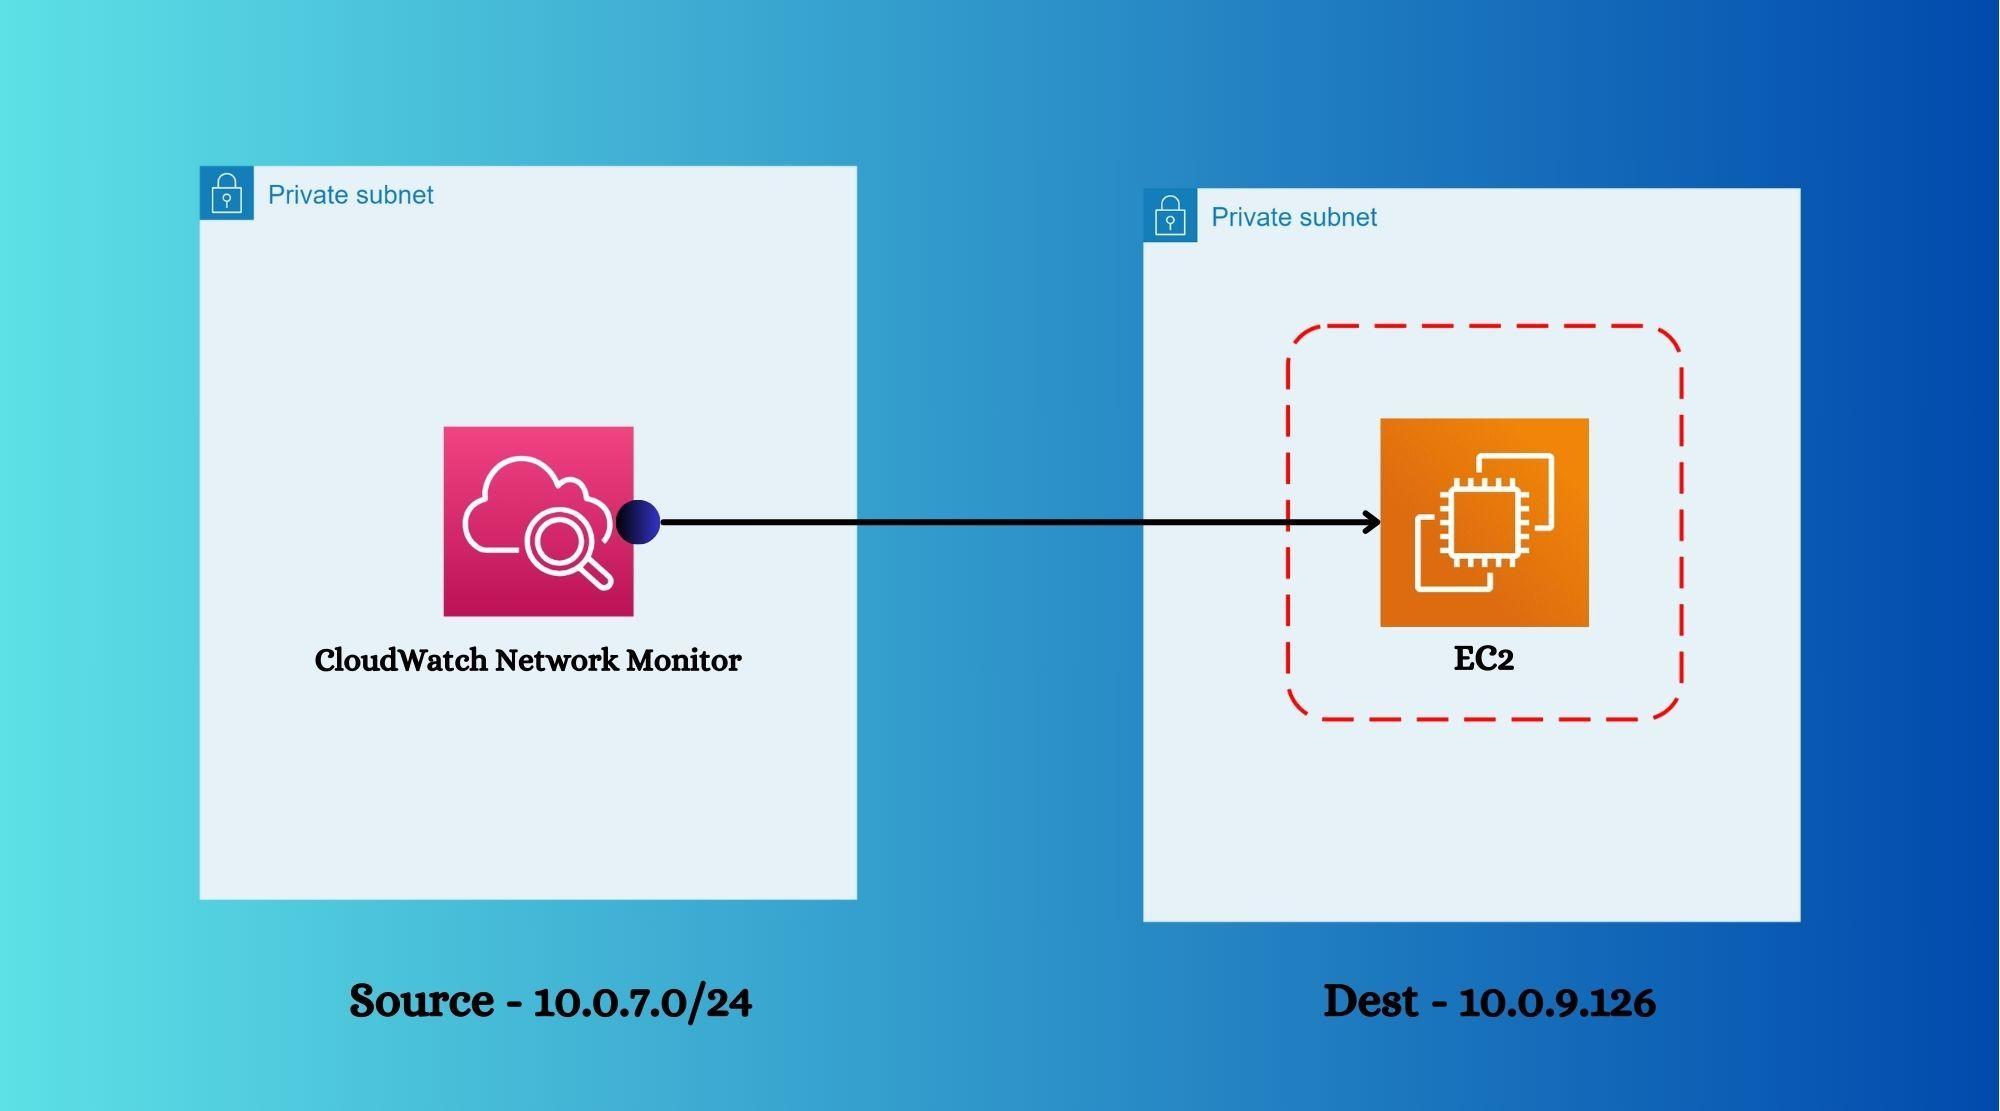
How CloudWatch Network Monitor Performs Connectivity Test to EC2 Instances
This article will guide on How to configure CloudWatch Network Monitor service to ensure proper server reachability
Published Jan 1, 2024
Last Modified Jan 2, 2024
Amazon Web Services recently released a feature in CloudWatch "Network Monitor" which is responsible to perform connectivity tests between source and destination. This feature doesn't require any manual user intervention, it's a manage service by AWS which works smoothly without any agents installation i.e. no requirement of agents as well. This feature not only works within AWS environment, but also works between AWS and On-Premises environment to ensure no connectivity losses.


Below steps to be followed to implement -
- Open CloudWatch console and click on "Network Monitor" option.
- Click on "Create Monitor" and provide the basic required details as below.

- Provide subnet name as "Source" and give "Destination IP" or IP ranges.

- Review the provided details and submit.

- Once submitted, the monitoring resource would be created along with provided probe information. Generally it takes time around 3-4 minutes to set up completely and come in "Active" state. After taking time to get metrics, it will display like below.

- Please make sure this resource status is "Healthy" which confirms successful connectivity test.
As we have provided aggregated time as 30s, so the servers will be pinged in each 30 seconds time interval and provide the status of healthiness since it creation.
If this connectivity test gets failed or interrupted due to some network glitches or failure, packet loss section would provide the value "100%" with graphical representation.

That defines the travel duration of traffics from source to destination.

TCP and ICMP these two protocols are supported by this feature for now. ICMP probes carry echo request from mentioned source address to mentioned destination address and if destination resources replies back with echo request, then it gets considered as successful connectivity test. RTT and packet loss both are calculated on metric information from source to destination and vice versa.
RTT = (time taken from source-to-destination) + (time taken from destination-to-source)
Packet Loss = (% loss from source-to-destination) + (% loss from destination-to-source)
Packet Loss = (% loss from source-to-destination) + (% loss from destination-to-source)
Note: The port number for corresponding protocol must be opened at security group level of that instance. For ICMP, it takes "All" in port section so no action required apart from adding ICMP rule, but in TCP, port needs to be taken care.
In case of TCP, probe carries TCP SYN packets from mentioned source details to destination and expects TCP SYN+ACK reply from destination.
Asia Pacific (Hong Kong) ap-east-1
Asia Pacific (Mumbai) ap-south-1
Asia Pacific (Seoul) ap-northeast-2
Asia Pacific (Singapore) ap-southeast-1
Asia Pacific (Sydney) ap-southeast-2
Asia Pacific (Tokyo) ap-northeast-1
Canada West (Calgary) ca-west-1
Europe (Frankfurt) eu-central-1
Europe (Ireland) eu-west-1
Europe (London) eu-west-2
Europe (Paris) eu-west-3
Europe (Stockholm) eu-north-1
Middle East (Bahrain) me-south-1
South America (São Paulo) sa-east-1
US East (N. Virginia) us-east-1
US East (Ohio) us-east-2
US West (N. California) us-west-1
US West (Oregon) us-west-2
- Open CloudWatch metrics and choose "AWS/NetworkMonitor" default namespace.
- Search with correct probe ID.
- Select the metrics and click on "bell" icon to configure alarms.

- Keep the details as it is and set condition that Packet Loss should not be greater than "0" as below -

- As a trigger, we have created EventBridge rule with lambda function, so that once packet loss alarm gets triggered, then it sends an email with sufficient information using SNS topic API.
Category: CloudWatch Alarm State Change
- Below is the schema of event pattern.
- Integrate EventBridge rule with Lambda function.

For simplicity, we have executed below command which changes the alarm status from OK to ALARM forcefully for short period of time.
As a result, alarm status of probe has been changed as below snap.
As a result, alarm status of probe has been changed as below snap.
Command: aws cloudwatch set-alarm-state --alarm-name "cw-network-packetloss-alarm-ec2" --state-value ALARM --state-reason "testing purposes"

Once lambda function is triggered successfully, it interacts with SNS topic to send email messages to subscribed email address.

Please check below link to get pricing estimation on CloudWatch NetworkMonitor.
In this article we have seen how we can configure agentless network monitoring system within AWS network or hybrid network to ensure proper monitoring of packet loss and other metrices.
Hope this blog will help you to configure the things properly. Please let me know for more information or suggestion and follow me to get more on AWS.
Hope this blog will help you to configure the things properly. Please let me know for more information or suggestion and follow me to get more on AWS.
Cheers!!
