
SageMaker Canvas: Analyze Your LinkedIn Data With No Code!
Learn to analyze LinkedIn data effortlessly using Amazon SageMaker Canvas. This article shows how to extract valuable insights without a single line of code.
Published Jan 26, 2024
I like to sum up everything I work on: projects, physical activity, self-education. And my social media presence is not an exception. Especially I like studying my LinkedIn analytics: how many impressions do I have? Was the last post something essential for my network?
But like all the consolidated dashboards, the LinkedIn dashboard has its limitations: you cannot go beyond the default analytics or extract the details you need.
Happily, there is a way to download the data and query it in a no-code way! Amazon SageMaker Canvas added the ability to use natural language for data preparation. Let’s see how can we leverage the power of this service to explore and extract insights from the LinkedIn analytics data in a no-code mode.
For example, you can ask your data questions! How many followers have I got for the last 365 days? What about last month? What was the day with the most impressions received? What about engagements?
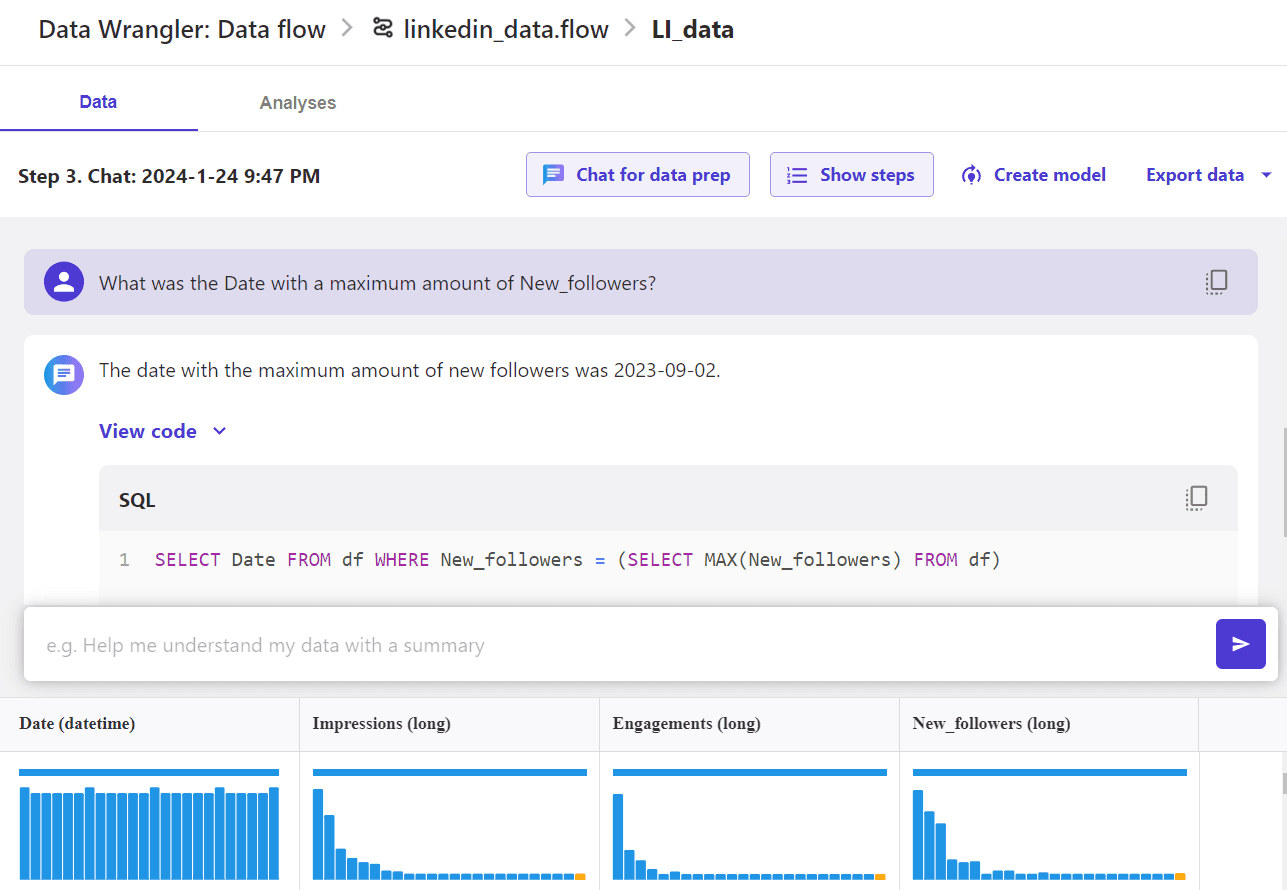
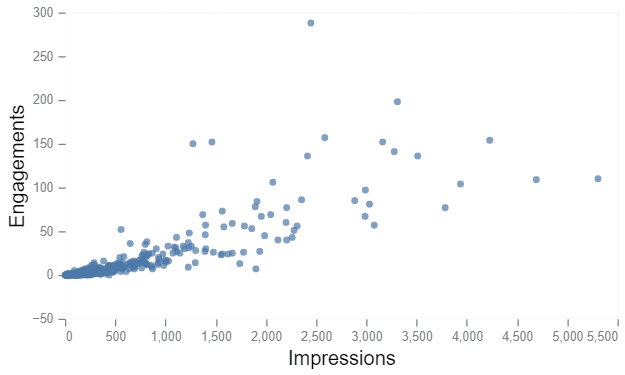
No-code data exploration is not limited to asking questions: you can ask to visualize different columns' relationships. Plot a tendency of followers, impressions, and engagements over time, find a correlation between them, and detect possible anomalies.
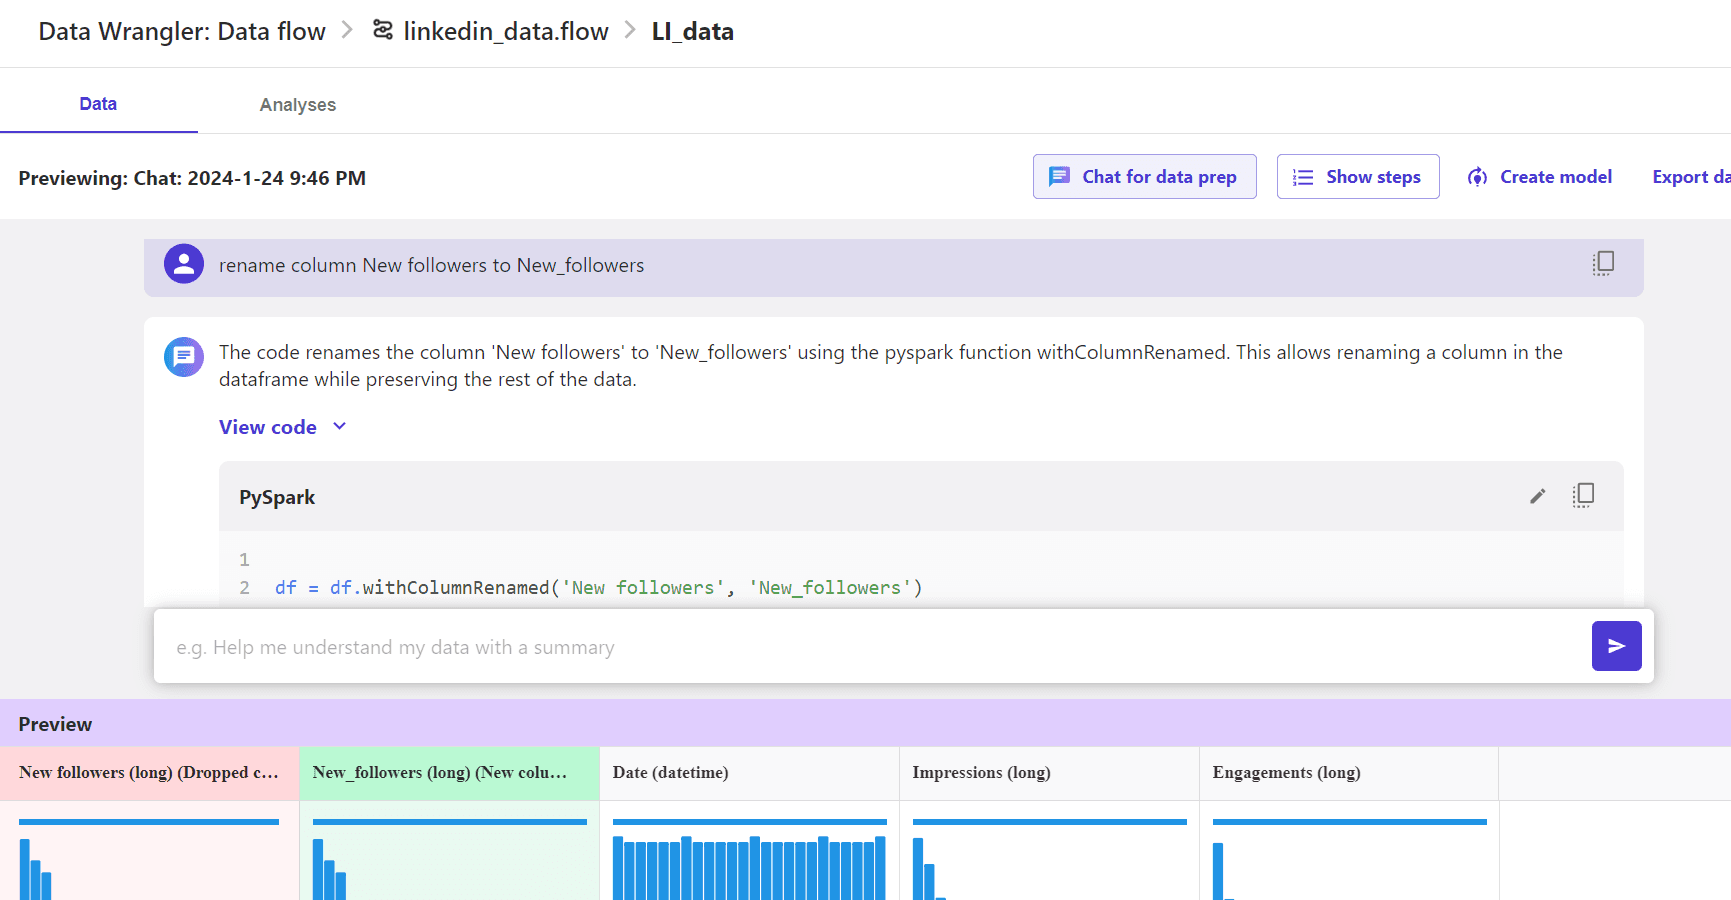
In the same way, you can process data: rename columns, change column format, drop columns, and clean outliers. If you are happy with a given data manipulation, you can automate its execution by adding it to steps.
On your LinkedIn profile page, go to the Analytics section and select ‘Show all analytics’. You will then see the dashboard page. Click whether on the ‘Post impressions’ or ‘Followers’ card. Then, on the Analytics page, to get more interesting results, make sure to set the period to 365 days. Download the results using the ‘Export’ button on the top right.
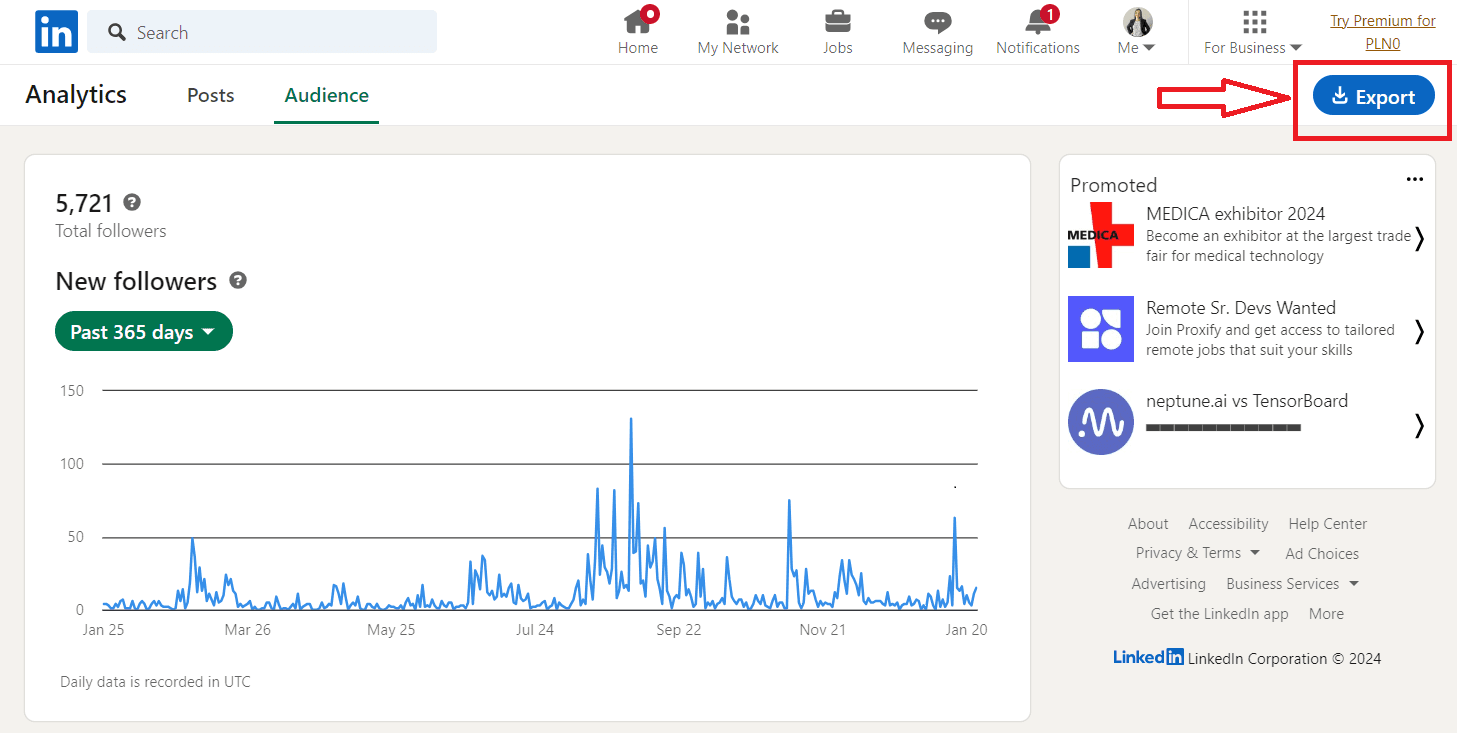
Note: for facilitating the future data preprocessing in SageMaker Canvas, several preparation steps were made: first and third Excel spreadsheets (Engagement and Followers) were saved as separate CSV files; first empty rows and summarizing rows were deleted.
To test the no-code data prep feature, make sure to:
- run SageMaker Canvas data prep in the same AWS Region as the Region where you're running your model. Chat for data prep is available in the US East (N. Virginia), US West (Oregon), and Europe (Frankfurt) AWS Regions
- submit your use case and request access to the Anthropic Claude model in the Amazon Bedrock. For more information, see Add model access.
- make sure that the domain you use for running SageMaker Canvas has AmazonSageMakerCanvasAIServicesAccess policy. In my case, this policy was added by default while creating a new domain.
You can find out more about the SageMaker Canvas data prep feature in the official documentation.
If you navigate to SageMaker inside your AWS account, you can spot Canvas on the left-hand side. If your account doesn’t have any created domain in the current region (remember to select N. Virginia, Oregon, or Frankfurt), you will need to Create a SageMaker domain. Then select Set up for single user (Quick setup) and click the ‘Set Up’ button.
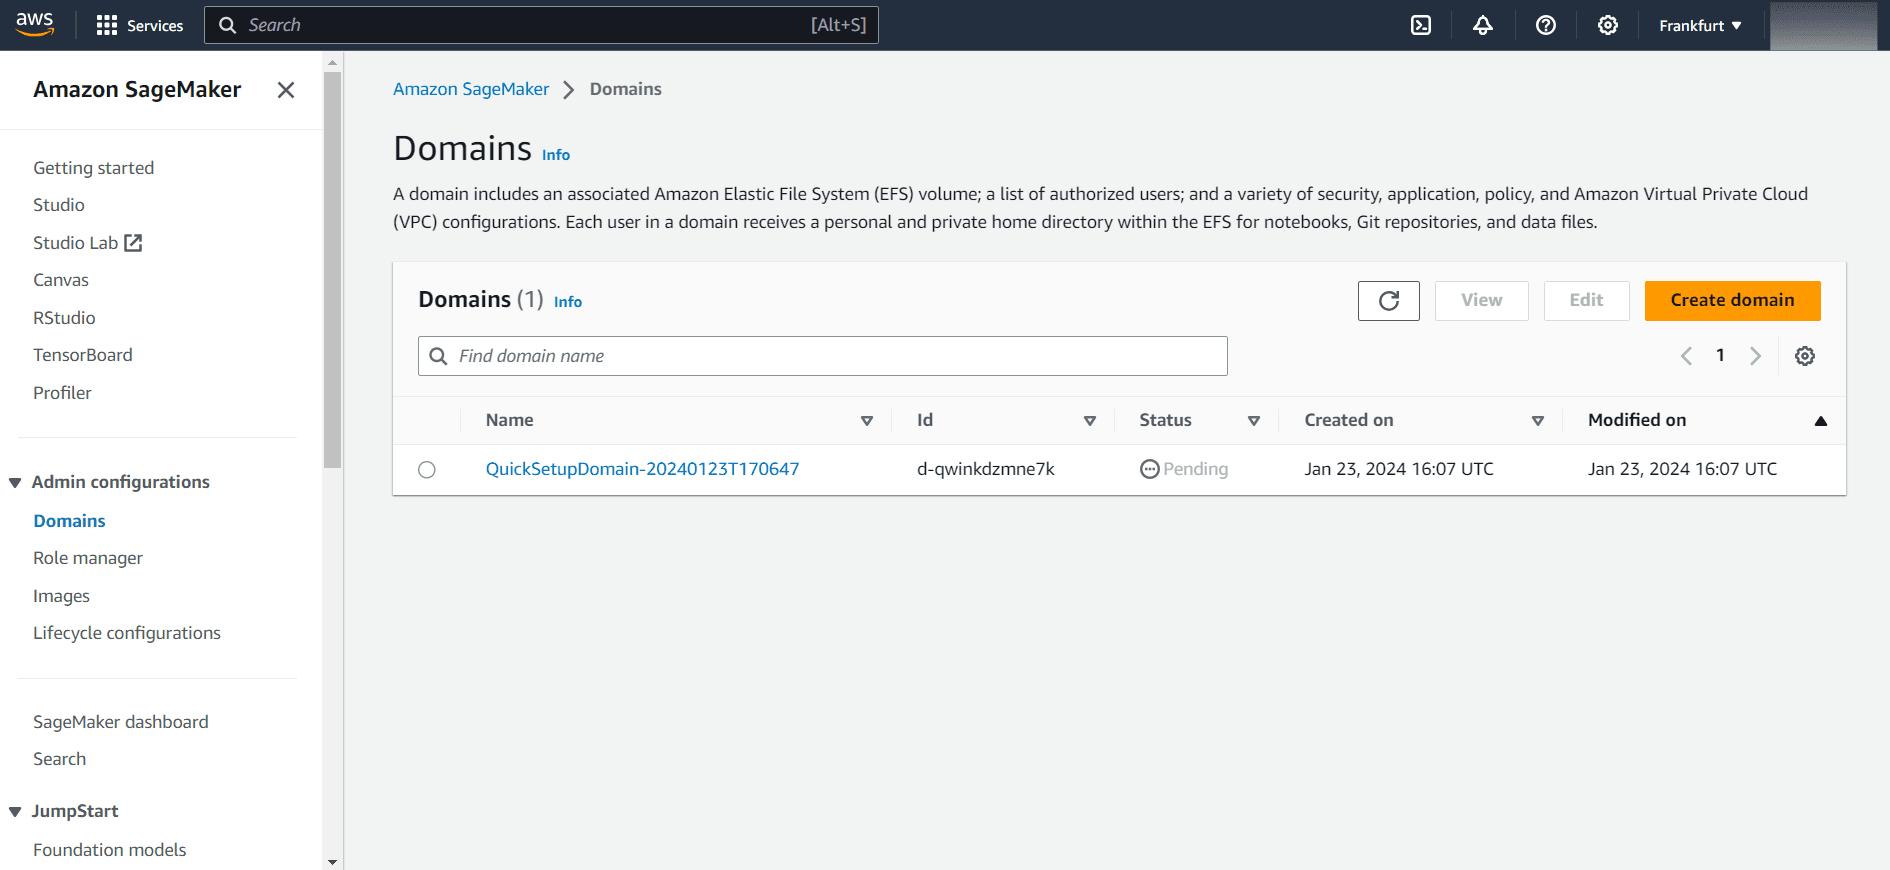
Once the creation process is finished (typically it takes a few minutes) go back to the Canvas and in the Get Started window click the ‘Open Canvas’ button. SageMaker Studio Canvas opens in a new browser tab, and in a few minutes, an application will be created.
If you are curious to learn more about the SageMaker domains, check out domain documentation.
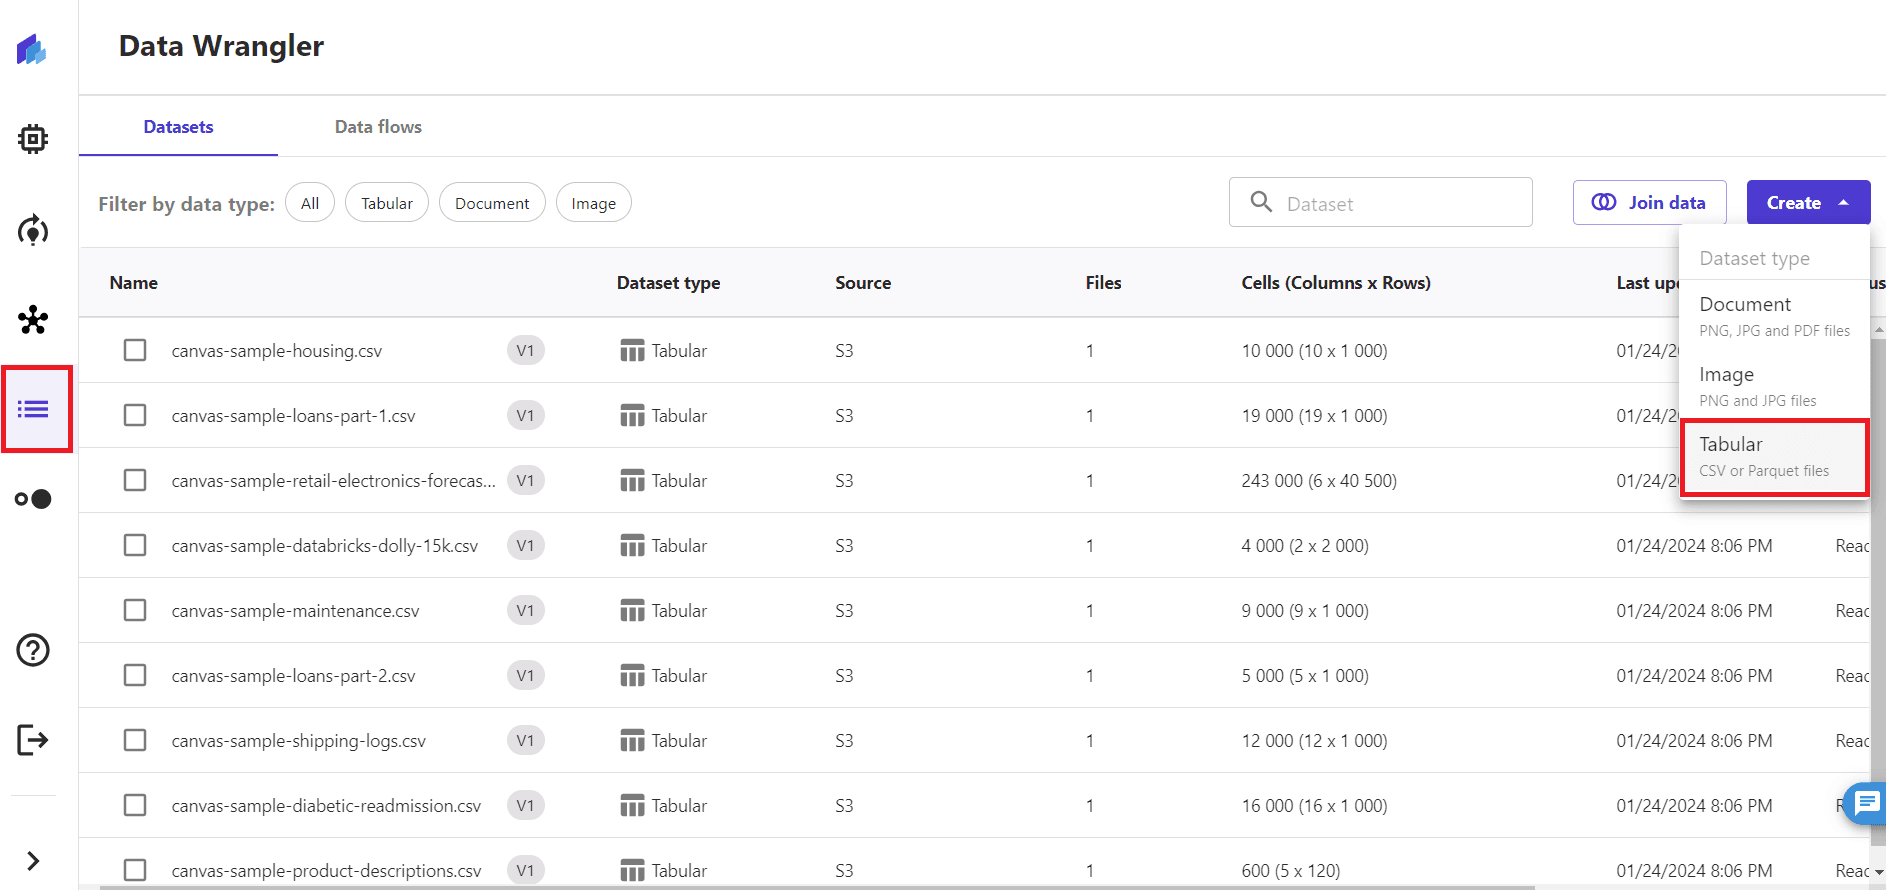
Once your SageMaker Canvas is ready, navigate to the Data Wrangel. You can see several default datasets already available there.
Let’s create new datasets by importing the data. On the right side click on the Create button and select Tabular from the drop-down list. Give your dataset a name (for example, Followers) and select a corresponding file to upload. Alternatively, you can first upload your files to S3 and use it as a Data Source instead of the Local Upload.
Once your data is validated and ready to import, click on the ‘Create dataset’ button.
Repeat the same steps for uploading the rest of your CSV files.
To get more information out of the available data, we will join datasets.
In the Data Wrangel page click on the ‘Join Datasets’ button. There you will find a graphical interface where you can join multiple datasets without any line of code.

Drag and drop your data, modify the join type and joining columns by clicking on the join node, and preview the join results.
When you are happy with the joined dataset, click the ‘Import data’ button in the bottom right. Give it a name and it will appear on the Data Wrangel page.
My LinkedIn data joined dataset contains the following information: date, number of new followers, number of engagements, and number of impressions.
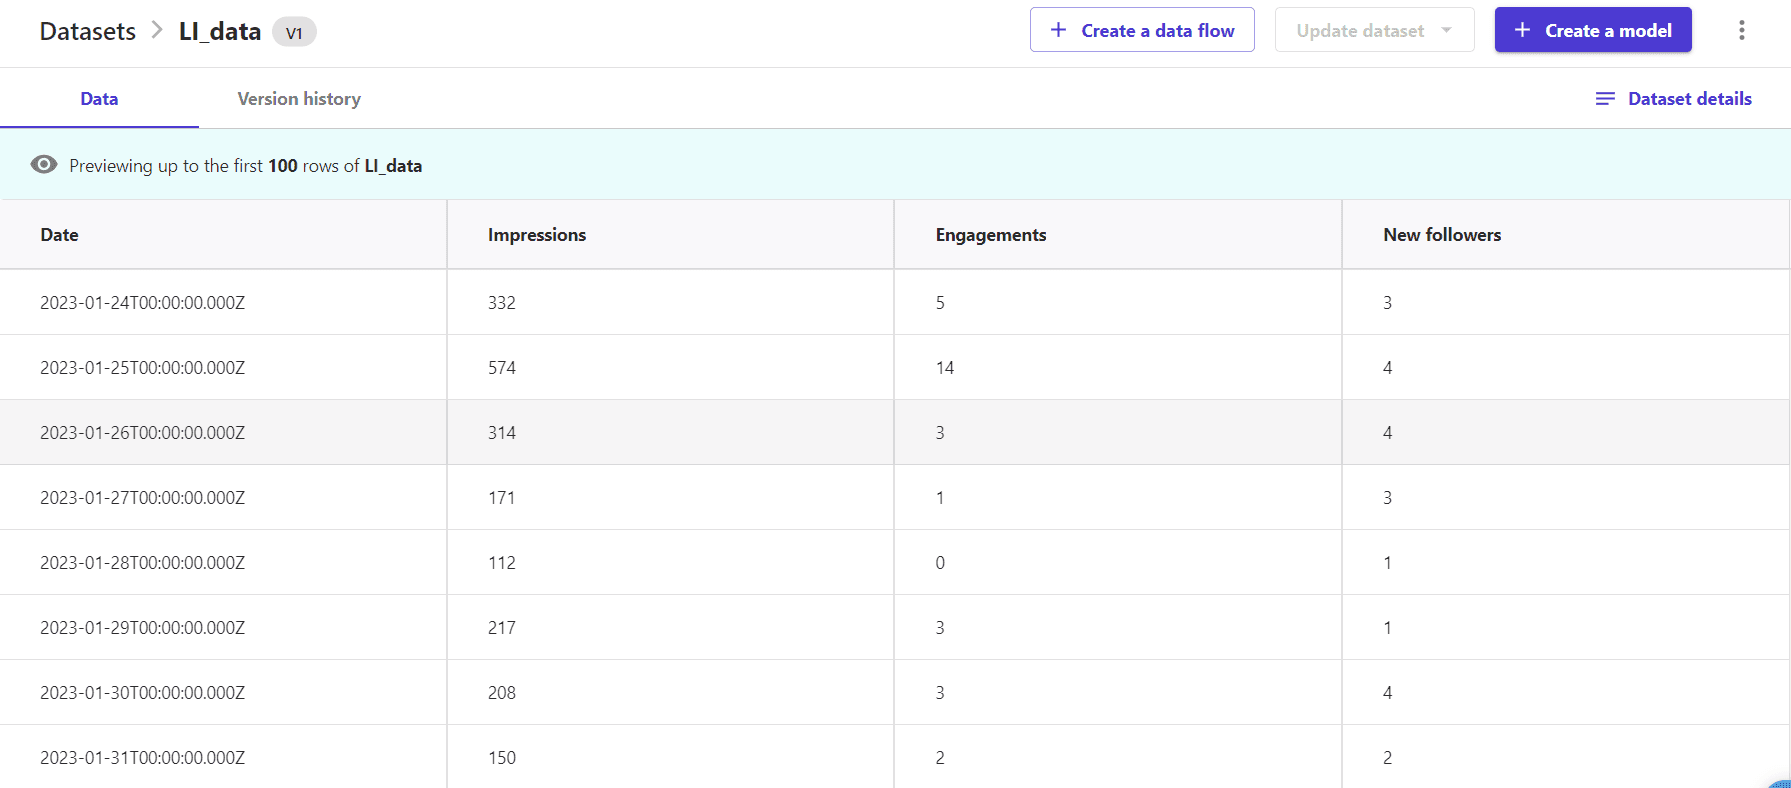
For using a data prep feature select your joined dataset and click on the Create a data flow. Give it a name and click on the ‘Create’ button.
Click on the ‘Chat for data prep’ button. You will see auto-suggested prompts. So let the exploration journey start!

After you finish your data analysis, don’t forget to delete the SageMaker domain. Otherwise, it could be a reason for generating undesired costs.
I hope you enjoyed reading the article, and I am very curious about how you find the Canvas data prep no-code feature. What interesting insights did you get from your data?
P.S. Some future ideas: given the simplicity of data querying and preprocessing, it might be interesting to use the Canvas data prep chat as a starting point with various Kaggle datasets/competitions. Combined with auto ML, it can become a baseline from where you can start working on any improvements.
