Apache Kafka Partitions as a Unit of Parallelism
Learn how to right-size your partitions for your Kafka workloads
Ricardo Ferreira
Amazon Employee
Published Mar 19, 2024
Last Modified Mar 20, 2024
Continue to Apache Kafka Partitions as Unit of Storage
Kafka was designed from the ground up to completely isolate producers and consumers. However, with Kafka, this is not just in an API level design like we see in other messaging systems. Kafka also allows producers and consumers to scale independently. This means that your producers may get crazy and write more data than the consumers can handle, and the consumers will still process those events as fast as they can without Kafka having to apply any back-pressure strategy. This is possible because Kafka acts as a buffer between producers and consumers, with persistence enabled by default. So higher write throughput doesn't affect slow read throughput. But why will read throughput ever be slower than writing?
To understand this, you must understand what happens when events are processed in Kafka. The consumer polls for new events, and once these events are fetched from the broker, they need to be deserialized. This is a very CPU consuming task and therefore, it must be counted towards processing time. Even more so if you are using formats like JSON, Thrift, Avro, and Protocol Buffers. After this, the consumer will start the actual processing of the events, which is tied to the business logic. Sometimes this is as simple as writing them off into a target system, but some other times it is a bit more complicated than that. What matters here is that processing those events doesn't come for free when it comes to resources utilization. You can surely know that CPU, memory, and network resources will be used for this. So whatever resource contention happens during this process, it must also count towards processing time. Finally, after processing the events, the consumer needs to inform Kafka that those events should be marked as processed. Otherwise, the same events will be included in the next event polling. This is done by committing the offsets from each one of those events. Figure 1 depicts all these steps.
As you can see from this narrative, processing events are not straightforward. While the narrative focused on explaining the stages of event processing, it intentionally gave you a positive perspective that everything just works. However, in the real world, lots of errors can happen during event processing, including the processing attempt of poison pills. These are events that can't be processed because they have invalid formats, wrong data types, or business-related problems such as events with integrity issues. When these events are polled, consumers may try to reprocess them unsuccessfully multiple times, while further events in the partition are blocked by the ones in the head. This is known as the head-of-line blocking problem. This problem was originally coined in the context of computer networking, but it also applies in the world of streaming data with Kafka. This is one of the most common problems that can slow down your read throughput.
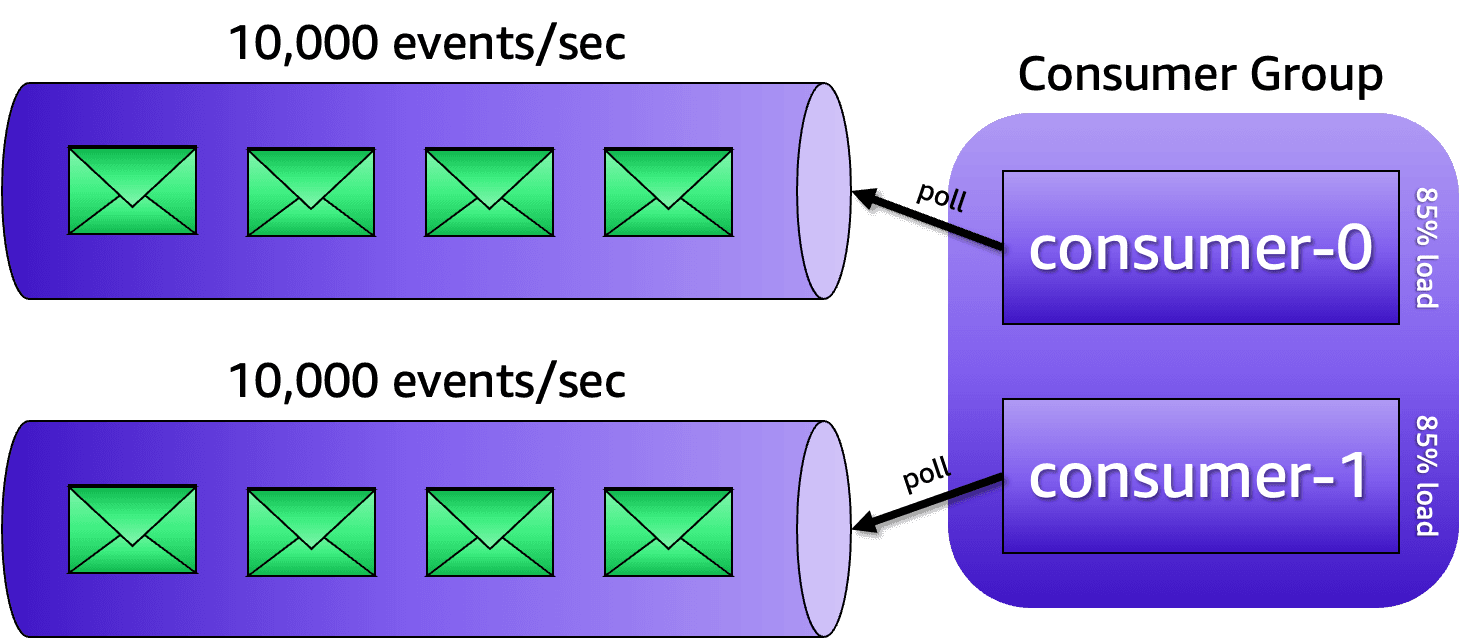
Another factor that causes read throughput slow down is how many consumers you use to process events. It can be challenging to get things processed fast with only one consumer processing events. In Kafka, multiple consumers can be used to process events simultaneously. If you increase the number of consumers, processing will be presumably faster, as long each consumer is running on different machines. Why? because as mentioned before, processing events doesn't come for free when it comes to resources utilization. Let's say processing 10,000 events requires 85% of the machine resources running your consumer. This means that to process 20,000 events, two machines with identical configuration are required. This way, you can scale out the event processing just by adding more consumer machines, right?
Technically, yes, but take this with a grain of salt. As mentioned before, when one or more consumers join a group, the group coordinator executes the partition assignment by executing the assignors configured. If the topic has only one partition, then it won't matter if you have multiple consumers running on different machines. Only one consumer will receive events while the others will remain idle. If you try to play dumb and put the consumers in different groups; then Kafka will broadcast the same events to each group, meaning that you will process the same events multiple times. This may lead to a serious problem of data consistency. Not much of a solution, right? The solution is creating more partitions. For example, if you have 2 partitions, you can have 2 consumers within the same group processing the events in parallel — each one being fed events from a dedicated partition. Figure 2 shows this example.
Having multiple partitions also helps to solve another problem, which is the broker becoming the bottleneck. If you have a single partition, then the partition will be hosted by a single broker. Your producers and consumers will always connect to that same broker, potentially exceeding the number of network concurrent connections it can handle. The solution is using multiple brokers to scale things out, but for this to happen, you need to configure your topics to have more partitions. When you create a topic, Kafka first decides how to distribute the partitions between the brokers.
Suppose you have 6 brokers and you decide to create a topic with 12 partitions. Kafka will distribute the partitions in such a way that each broker will end up with 2 partitions. Now your producers and consumers can start network connections with different brokers concurrently and remove the bottleneck from the equation. Of course, the actual distribution is a bit more complicated than this, as you will see later when I discuss replicas. But for now, just know that the broker bottleneck is a solved problem if you create multiple partitions.
All of this may get you thinking about creating as many partitions as you need. Incidentally, your instinct will be to create empirical ways to come up with a usable number. I don't fancy criticizing any method. Whatever works for you is the best method you should use. However, if I could be of any help, here is a method that has been proved to produce good "good enough" numbers. Since partitions are your unit-of-parallelism, you can use your target throughput, measured in events per second, as criteria. You start by measuring the write throughput that you can achieve with a single partition, and then the read throughput. While measuring this, it is important to consider only one partition because this is your unit of scale.
The easiest way to measure write and read throughput is by using the tools
kafka-producer-perf-test
and kafka-consumer-perf-test
that are available in the /bin
folder of your Kafka distribution. For example, to test if a partition can handle 2,000 events per second, with each event containing 1024 bytes of payload size, you can send 100,000 from a machine using this command:This command will produce an output similar to this:
The 100,000 events are sent in batches. On each batch, it is calculated how many data could actually fit in the desired throughput of 2,000 events per second. The reading here is that the producer could do this only once, when it could send
2022.6
events per second. There is surely a contention somewhere. It may be because of compression, network bandwidth, throttling rules from your egress NAT gateway, or maybe the machine doesn't have enough resources to achieve that throughput. The next step is to change the target throughput until you reach a number of events per second that will be constant throughout all batches sent. This will be your measured write throughput. If you know where the contention is; and if you can do something about, instead of changing your target throughput you can simply work towards fixing the issues. But in my experience, these two ifs are usually mutually exclusive.Measuring read throughput is similar. For example, to test how much throughput a single partition can handle if it tries to process 100,000, you can use this command:
This command will produce an output similar to this:
The columns that you are after here are
MB.sec
and nMsg.sec
, which tells you exactly the throughput achieved in MB/s and in terms of the number of events fetched. In this example, the machine could handle up to 6.1617
MB/s, which was the equivalent of 6310.1413
events per second. If the number of events per second fetched multiplied by the payload size came close to the MB/s number, then you are getting somewhere. Just like you did while measuring the write throughput, you must work towards reaching a number that will be constant throughout different executions of this command. As a best practice, consider that the read throughput is going to be usually higher than your write throughput. This happens because, once stored, you will likely share the same events with different systems. A good rule-of-thumb is considering that your read throughput will be 3X higher than your write throughput. Therefore, whatever number you got while measuring the read throughput, multiply it by 3 to be on the safe side.Once you have measured the write and read throughput that a single partition can handle, you can use those numbers in the following formula:
NUM_PARTITIONS = MAX(T/W, T/R)
Here,
T
is your target throughput, W
is your measured write throughput, and R
is your measured read throughput. The result is how many partitions you need for a topic. With that said, use this formula at your discretion. Also, take into account that the measured read throughput doesn't consider business logic processing. You should think about this as well.Continue to Apache Kafka Partitions as Unit of Storage
Any opinions in this post are those of the individual author and may not reflect the opinions of AWS.