Reduce AWS Costs by Stopping Idle EC2 Instances with CloudWatch Alarms
Reduce AWS Costs through Alarm Notifications
Published May 27, 2024
- Metric : A metric is performance data that you monitor over time. Like a variable that will have different values over time, the variation in these values is important to make decisions to ensure that the application works as it should. Metrics can include CPU utilization, disk I/O, memory usage, and custom application metrics. They are collected at regular intervals and stored in CloudWatch.
- Threshold : This is the value against which the metric data is evaluated. For example, you might set a threshold of 70% CPU utilization. Depending on whether the metric value is under, equal to, or greater than the threshold, you can trigger actions.
- Period (in seconds) : The period determines the frequency at which the value of the metric is collected. This can range from seconds to several hours, depending on your needs.
- Statistic : This specifies how the metric data is aggregated over each period. Common statistics include Average, Sum, Minimum and Maximum. If the metric is collected every minute and you choose an alarm period of 5 minutes, the metric value for each period will be calculated as the average of the 5 values collected within the 5-minute period.
- Evaluation Periods : The number of recent periods that will be considered to evaluate the state of the alarm, based on the metric values during these periods.
- Datapoints to Alarm : The number of evaluation periods during which the metric must breach the threshold to trigger the alarm. For instance, if you have 3 evaluation periods and set 2 datapoints to alarm, the threshold must be breached in at least 2 of the 3 periods to trigger the alarm.
- Alarm Actions : Actions that are taken when the alarm state changes. These can include sending notifications via Amazon SNS, stopping, terminating, or rebooting an EC2 instance, invoking an AWS Lambda function, or performing an Auto Scaling action. Multiple actions can be configured for a single alarm.
- Example:
The alarm example is set to monitor the average CPU utilization of an EC2 instance. The CPUUtilization metric is collected and aggregated into 5-minute periods. The alarm evaluates the average CPU utilization over 3 consecutive periods. If the average CPU utilization exceeds the threshold of 70% for at least 2 out of the 3 evaluation periods, the alarm triggers the defined actions.
- Metric : CPUUtilization
- Statistic : Average
- Period : 300 seconds (5 minutes)
- Threshold : 70%
- Alarm condition : Greater or Equal
- Evaluation Periods : 3
- Datapoints to Alarm : 2
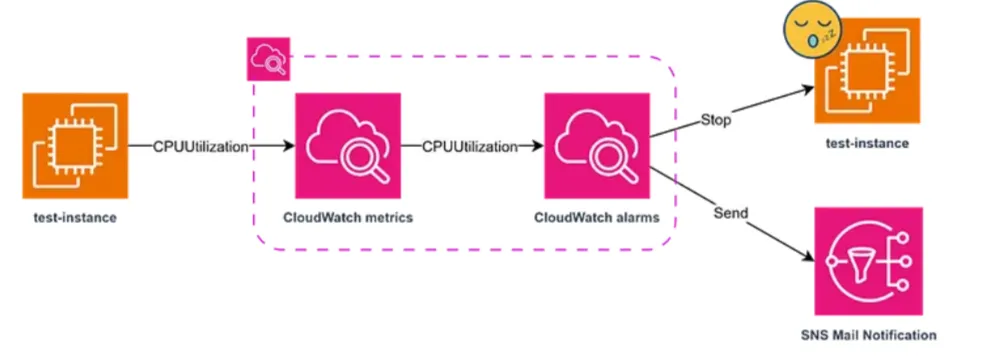
The metric that I choose to detect an inactive instance is CPUUtilization, which is collected by default every 5 minutes and sent to CloudWatch. The alarm is triggered only if the CPU utilization remains below 2% at any period during one hour (12 consecutive periods of 5 minutes each). The actions triggered by the alarm are stopping the instance and notifying me by email.
- Metric : CPUUtilization
- Statistic : Average
- Period : 300 seconds (5 minutes)
- Threshold : 2%
- Alarm condition : Lower or Equal
- Evaluation Periods : 12
- Datapoints to Alarm : 12
- Actions : SNS mail notification + EC2 stop Instance
Setting Up an CloudWatch alarms to detect over spending and running of the applications.