Monitor VPC interface endpoints with CloudWatch
This blog post highlights the monitoring metrics and alarms of VPC interface interface using CloudWatch.
Published May 31, 2024
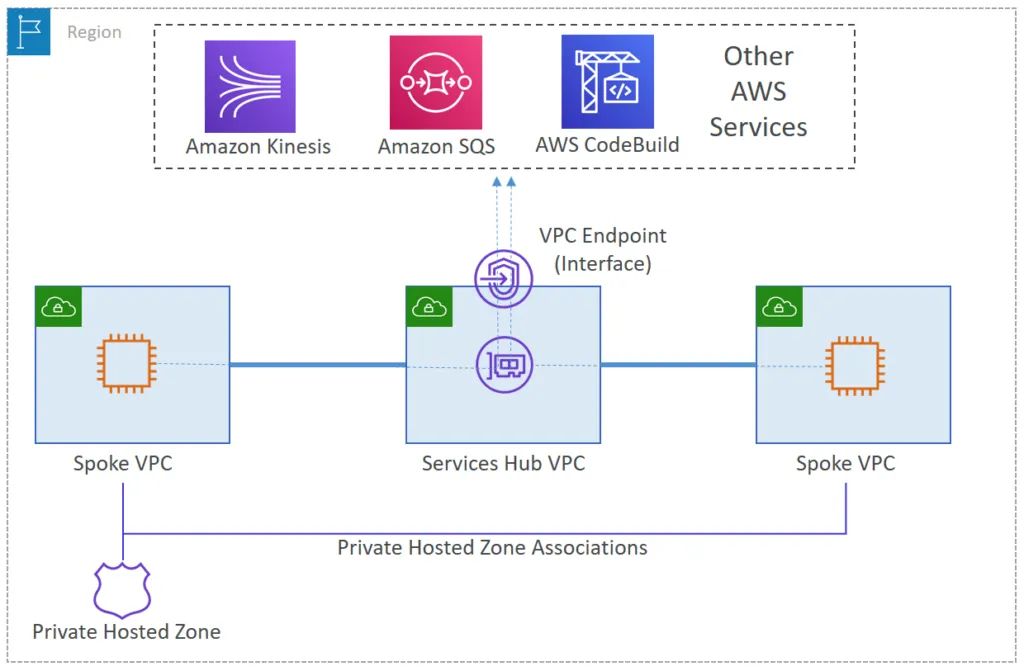
An interface endpoint allows you to connect your private IP address to various AWS services such as an elastic load balancer, CloudFormation, SNS, S3, and more. It also enables you to connect to supported marketplace partner services hosted by AWS partners or customers within their own VPCs. Traffic from the VPC resources to the endpoint ENI is managed by your security group. Furthermore, Private Link ensures that the VPC traffic to other AWS services doesn't reach the public internet.
To communicate with AWS APIs, you either need a NAT gateway or VPC endpoints. S3 and DynamoDB are special because they support gateway endpoints. All other AWS services support interface endpoints.

That’s why you need to add monitoring to be alerted if the interface endpoint gets a bottleneck.
- Create a new interface endpoint. Provide the name of the AWS service or endpoint service with which you want private connectivity.
- Create a network interface ENI and select the subnet to use the interface endpoint.
- From the IP address range of the subnet, a private IP is assigned to the endpoint network interface. This private IP address will be retained until the interface endpoint is removed.
- The private IP address ensures that the traffic does not leave the Amazon network without making any changes to the route table.
Each interface endpoint sends metrics to CloudWatch that can be monitored using CloudWatch alarms. I recommend creating alarms for the following metrics:
PacketsDropped: The interface endpoint's number of dropped packets (an increase could indicate that the endpoint or endpoint service is unhealthy).RstPacketsReceived: The interface endpoint receives a certain number of RST packets. An increase in this value could indicate that the endpoint service is unhealthy.
Unfortunately, interface endpoints do not report a single metric on the throughput utilization of bandwidth. The maximum bandwidth is 100 Gbit/second. However, we can calculate throughput by using CloudWatch metric math.
To calculate the bandwidth utilization, we use the following metrics:
| ID | Mertics | Statistic | Period |
|---|---|---|---|
| bytesProcessed | BytesProcessed | Sum | 60 |
In this case, the 'BytesProcessed' metric is used, which is the amount of data processed by the interface endpoint. The 'Sum' statistical method adds up all the data points for a specific period, which is 60 seconds in this case.
And the following expressions:
| ID | Expression | Remarks |
|---|---|---|
| bandwidth | bytesProcessed/60*8/1000/1000/1000 | Bytes/min to Gbit/s |
| utilization | bandwidth/45*100 | to %; 45 Gbit/s is the hard limit |
The
bandwidth expression takes the bytes processed per minute, converts it to Gigabits per second (Gbit/s) and the utilization expression then calculates the percentage of the available 45 Gbit/s that is being used.In conclusion, monitoring VPC interface endpoints with CloudWatch metrics and alarms, as well as monitoring throughput utilization, allows us to ensure the optimal performance and availability of it in our network configuration.
